해당 내용은 Coursera의 딥러닝 특화과정(Deep Learning Specialization)의 첫 번째 강의 Neural Networks and Deep Learning를 듣고 정리한 내용입니다. (Week 2)
딥러닝 특화과정 첫 번째 강의 2주차 실습을 진행하면서 복습해보려고 합니다.
목표는 Logistic Regression을 사용해서 고양이를 인식하는 분류기를 만드는 것입니다.
진행 순서는 다음과 같습니다.
1. 파라미터 초기화
2. Cost Function과 Gradient 계산
3. Gradient Descent를 통해서 최적화
우리는 이 3가지의 동작을 하는 함수를 각각 만들고, 마지막에 위 함수들을 main model에서 사용할 것입니다.
1. Packages
이 분류기에서 사용되는 라이브러리는 다음과 같습니다.
import numpy as np
import matplotlib.pyplot as plt
import h5py
import scipy
from PIL import Image
from scipy import ndimage
from lr_utils import load_dataset

%matplotlib inline
numpy - 수치 계산을 위한 기본 패키지
h5py - H5 file에 저장된 dataset을 다루기 위한 패키지
matplotlib - 그래프를 그리기 위한 패키지
PIL, scipy - 마지막에 사용자가 업로드한 사진을 테스트하기 위해 사용되는 패키지
2. Overview
# Loading the data (cat/non-cat)
train_set_x_orig, train_set_y, test_set_x_orig, test_set_y, classes = load_dataset()
load_dataset 함수를 통해서 traininig set과 test set을 불러옵니다.
각 이미지의 shape는 (num_px, num_px, 3)으로 3차원 데이터이며, 여기서 3은 3 channels(RGB) 이미지를 뜻합니다.
우선 training set의 개수 m_train과 test_set의 개수 m_test, 그리고 이미지의 픽셀 수를 구해봅니다.
### START CODE HERE ### (≈ 3 lines of code)
m_train = train_set_x_orig.shape[0]
m_test = test_set_x_orig.shape[0]
num_px = train_set_x_orig.shape[1]
### END CODE HERE ###

print ("Number of training examples: m_train = " + str(m_train))
print ("Number of testing examples: m_test = " + str(m_test))
print ("Height/Width of each image: num_px = " + str(num_px))
print ("Each image is of size: (" + str(num_px) + ", " + str(num_px) + ", 3)")
print ("train_set_x shape: " + str(train_set_x_orig.shape))
print ("train_set_y shape: " + str(train_set_y.shape))
print ("test_set_x shape: " + str(test_set_x_orig.shape))
print ("test_set_y shape: " + str(test_set_y.shape))
결과:

위와 같은 결과값을 얻을 수 있습니다.
train_set_x_orig은 m_train x num_px x num_px x 3 의 차원을 갖는 행렬이고, train_set_y는 1 x m 행렬이라는 것을 알 수 있습니다.
train_set_x_orig에서 각각의 dimension을 구하는 방법은 train_set_x_orig.shape[0], train_set_x_orig.shape[1], train_set_x_orig.shape[2], train_set_x_orig.shape[3]으로 구할 수 있습니다.
shape[]는 numpy 행렬에서 사용할 수 있으며, train set과 test set은 numpy 배열의 타입을 갖고 있습니다.
각 이미지는 3차원의 행렬로 이루어져 있는데, Logistic Regression을 사용하려면 입력을 1차원 벡터로 변환해야합니다.
따라서 (num_px, num_px, 3) 차원을 (num_px * num_px * 3, 1)로 변환해주는 작업이 필요합니다.
만약 (a, b, c, d) 차원의 행렬 X가 있다면, 다음과 같은 방법으로 (b*c*d, a)로 변환할 수 있습니다.
X_flatten = X.reshape(X.shape[0], -1).T여기서 .T는 X 행렬을 Transpose 하는 것이고, 우리는 입력을 \(\begin{bmatrix} | && | && && | \\ x^{(1)} && x^{(2)} && \cdots && x^{(m)} \\ | && | && && | \end{bmatrix}\) 꼴로 만들기 위해서 위와 같이 변환했습니다.
아래와 같은 방법으로 train과 test set의 입력 차원을 변환해주면 됩니다.
# Reshape the training and test examples

### START CODE HERE ### (≈ 2 lines of code)
train_set_x_flatten = train_set_x_orig.reshape(train_set_x_orig.shape[0], -1).T
test_set_x_flatten = test_set_x_orig.reshape(test_set_x_orig.shape[0], -1).T
### END CODE HERE ###

print ("train_set_x_flatten shape: " + str(train_set_x_flatten.shape))
print ("train_set_y shape: " + str(train_set_y.shape))
print ("test_set_x_flatten shape: " + str(test_set_x_flatten.shape))
print ("test_set_y shape: " + str(test_set_y.shape))
print ("sanity check after reshaping: " + str(train_set_x_flatten[0:5,0]))

위 과정을 통해서 우리는 입력 train_set_x_orig를 (209, 64, 64, 3) 에서 (64*64*3, 209)의 모양을 갖도록 변환했습니다.
그리고 학습 알고리즘을 수행하기 전에 입력을 normalization(or standardization)해줍니다. 픽셀의 범위는 0 ~ 255 이기 때문에, 범위의 크기만큼 입력값을 나누어주어서 0 ~ 1의 범위를 갖도록 합니다.
train_set_x = train_set_x_flatten/255.
test_set_x = test_set_x_flatten/255.
여기까지가 데이터의 전처리과정이었습니다.
3. General Architecture of the learning algorithm
이제 고양이를 분류하는 간단한 알고리즘을 디자인할 것인데, 아래와 같이 Logistic Regression을 Single Neural Network를 사용해서 구현할 것입니다.

하나의 샘플 \(x^{(i)}\)에 대해서 다음과 같은 결과를 구합니다.
\[\begin{align*} z^{(i)} &= w^Tx^{(i)} + b \\ \hat{y}^{(i)} &= a^{(i)} = sigmoid(z^{(i)}) \\ \mathscr{L}(a^{(i)}, y^{(i)}) &= -y^{(i)}log(a^{(i)}) - (1 - y^{(i)})log(1 - a^{(i)}) \end{align*}\]
그리고 Cost Function은 다음과 같이 구할 수 있습니다.
\[J = \frac{1}{m}\sum_{i = 1}^{m}\mathscr{L}(a^{(i)}, y^{(i)})\]
주요 과정은 다음과 같습니다.
1. model의 파라미터 초기화(initialization)
2. Cost를 최소화하는 파라미터 학습
3. 학습된 파라미터를 통해 test set 예측
4. 실제 결과와 예측값을 분석
4. Building the parts of out algorithm
Neural Network를 구성하는 것은 다음과 같은 방법으로 진행합니다.
1. model structure 정의(input feature의 수와 같은 것들)
2. model의 파라미터 초기화
3. 아래 과정 반복
- Calculate current loss(forward propagation)
- Calculate current gradient(backward propagation)
- Update parameters(gradient descent)
우리는 1~3번의 과정을 각각 함수로 구현하고, model()을 통해서 하나의 함수로 통합할 것입니다.
우선 시작하기 전에, 부가적으로 필요한 함수들을 먼저 정의하겠습니다.
필요한 함수는 sigmoid를 반환하는 함수, 파라미터 초기화 함수 입니다.
4.1 sigmoid function
FP에서 activation을 계산하기 위한 sigmoid 계산 함수를 구현합니다.
\[sigmoid(w^T + b) = \frac{1}{1 + e^{-(w^Tx + b)}}\]
여기서 \(w^T + b\)는 간단히 \(z\)로 표현됩니다.
# GRADED FUNCTION: sigmoid

def sigmoid(z):
    """
    Compute the sigmoid of z

    Arguments:
    z -- A scalar or numpy array of any size.

    Return:
    s -- sigmoid(z)
    """

    ### START CODE HERE ### (≈ 1 line of code)
    s = 1 / (1 + np.exp(-z))
    ### END CODE HERE ###

    return s
4.2 initializing parameters
Logistic Regression은 파라미터를 0으로 초기화하면 됩니다. numpy에서 제공하는 함수인 np.zeros((shape))를 사용해서 파라미터들을 0으로 초기화하여 반환하는 함수를 구현하겠습니다.
# GRADED FUNCTION: initialize_with_zeros

def initialize_with_zeros(dim):
    """
    This function creates a vector of zeros of shape (dim, 1) for w and initializes b to 0.

    Argument:
    dim -- size of the w vector we want (or number of parameters in this case)

    Returns:
    w -- initialized vector of shape (dim, 1)
    b -- initialized scalar (corresponds to the bias)
    """

    ### START CODE HERE ### (≈ 1 line of code)
    w = np.zeros((dim, 1))
    b = 0
    ### END CODE HERE ###

    assert(w.shape == (dim, 1))
    assert(isinstance(b, float) or isinstance(b, int))

    return w, b
이제 FP와 BP를 진행하는 함수를 구현해보겠습니다
4.3 Forward and Backward propagation
아래와 같은 계산을 하는 함수입니다.
activation은 아래와 같은 식으로 계산되고,
\[A = g(w^TX + b) = (a^{(1)}, a^{(2)}, \cdots, a^{(m-1)}, a^{(m)})\]
Cost Function은 아래와 같은 식으로 계산됩니다.
\[J = \frac{1}{m}\sum_{i = 1}^{m}\mathscr{L}(a^{(i)}, y^{(i)})\]
그리고 BP에서의 미분항은 다음과 같은 식으로 계산됩니다.

# GRADED FUNCTION: propagate

def propagate(w, b, X, Y):
    """
    Implement the cost function and its gradient for the propagation explained above

    Arguments:
    w -- weights, a numpy array of size (num_px * num_px * 3, 1)
    b -- bias, a scalar
    X -- data of size (num_px * num_px * 3, number of examples)
    Y -- true "label" vector (containing 0 if non-cat, 1 if cat) of size (1, number of examples)

    Return:
    cost -- negative log-likelihood cost for logistic regression
    dw -- gradient of the loss with respect to w, thus same shape as w
    db -- gradient of the loss with respect to b, thus same shape as b

    Tips:
    - Write your code step by step for the propagation. np.log(), np.dot()
    """

    m = X.shape[1]

    # FORWARD PROPAGATION (FROM X TO COST)
    ### START CODE HERE ### (≈ 2 lines of code)
    A = sigmoid(np.dot(w.T, X) + b)                                      # compute activation
    cost = (-1/m)*(np.sum(Y*np.log(A)) + np.sum((1 - Y)*np.log(1 - A)))  # compute cost
    ### END CODE HERE ###

    # BACKWARD PROPAGATION (TO FIND GRAD)
    ### START CODE HERE ### (≈ 2 lines of code)
    dw = (1/m)*np.dot(X,(A - Y).T)
    db = (1/m)*np.sum(A - Y)
    ### END CODE HERE ###

    assert(dw.shape == w.shape)
    assert(db.dtype == float)
    cost = np.squeeze(cost)
    assert(cost.shape == ())

    grads = {"dw": dw,
             "db": db}

    return grads, cost
propagate 함수는 FP와 BP를 계산해서 grads(dict 타입), cost를 반환합니다.
4.4 Optimization
이제 위에서 구현한 propagate함수를 반복하면서 Cost를 최소화하는 함수를 구현합니다. 이 함수는 최적화된 파라미터와 계산된 미분값, Cost를 반환합니다.
매 순회마다 파라미터는 parameter \(\theta = \theta - \alpha d\theta\)로 업데이트됩니다.
# GRADED FUNCTION: optimize

def optimize(w, b, X, Y, num_iterations, learning_rate, print_cost = False):
    """
    This function optimizes w and b by running a gradient descent algorithm

    Arguments:
    w -- weights, a numpy array of size (num_px * num_px * 3, 1)
    b -- bias, a scalar
    X -- data of shape (num_px * num_px * 3, number of examples)
    Y -- true "label" vector (containing 0 if non-cat, 1 if cat), of shape (1, number of examples)
    num_iterations -- number of iterations of the optimization loop
    learning_rate -- learning rate of the gradient descent update rule
    print_cost -- True to print the loss every 100 steps

    Returns:
    params -- dictionary containing the weights w and bias b
    grads -- dictionary containing the gradients of the weights and bias with respect to the cost function
    costs -- list of all the costs computed during the optimization, this will be used to plot the learning curve.

    Tips:
    You basically need to write down two steps and iterate through them:
        1) Calculate the cost and the gradient for the current parameters. Use propagate().
        2) Update the parameters using gradient descent rule for w and b.
    """

    costs = []

    for i in range(num_iterations):


        # Cost and gradient calculation (≈ 1-4 lines of code)
        ### START CODE HERE ###
        grads, cost = propagate(w, b, X, Y)
        ### END CODE HERE ###

        # Retrieve derivatives from grads
        dw = grads["dw"]
        db = grads["db"]

        # update rule (≈ 2 lines of code)
        ### START CODE HERE ###
        w = w - (learning_rate)*dw
        b = b - (learning_rate)*db
        ### END CODE HERE ###

        # Record the costs
        if i % 100 == 0:
            costs.append(cost)

        # Print the cost every 100 training iterations
        if print_cost and i % 100 == 0:
            print ("Cost after iteration %i: %f" %(i, cost))

    params = {"w": w,
              "b": b}

    grads = {"dw": dw,
             "db": db}

    return params, grads, costs
마지막으로 학습된 파라미터를 가지고 예측값을 반환하는 함수 predict를 구현합니다.
이 함수는 다음과 같은 step으로 진행됩니다.
1. \(\hat{Y}\)를 계산합니다.
\[\hat{Y} = A = sigmoid(w^TX + b)\]
2. 결과값을 변환하는데, 결과값이 0.5보다 작거나 같으면 0(non-cat), 0.5보다 크다면 1(cat) 입니다.
# GRADED FUNCTION: predict

def predict(w, b, X):
    '''
    Predict whether the label is 0 or 1 using learned logistic regression parameters (w, b)

    Arguments:
    w -- weights, a numpy array of size (num_px * num_px * 3, 1)
    b -- bias, a scalar
    X -- data of size (num_px * num_px * 3, number of examples)

    Returns:
    Y_prediction -- a numpy array (vector) containing all predictions (0/1) for the examples in X
    '''

    m = X.shape[1]
    Y_prediction = np.zeros((1,m))
    w = w.reshape(X.shape[0], 1)

    # Compute vector "A" predicting the probabilities of a cat being present in the picture
    ### START CODE HERE ### (≈ 1 line of code)
    A = sigmoid(np.dot(w.T, X) + b)
    ### END CODE HERE ###

    for i in range(A.shape[1]):

        # Convert probabilities A[0,i] to actual predictions p[0,i]
        ### START CODE HERE ### (≈ 4 lines of code)
        if A[0, i] >= 0.5:
            Y_prediction[0, i] = 1
        else:
            Y_prediction[0, i] = 0
        ### END CODE HERE ###

    assert(Y_prediction.shape == (1, m))

    return Y_prediction
5. Merge all functions into a model
이제 위에서 구현한 함수들을 model이라는 함수로 합치는 과정을 진행합니다.
# GRADED FUNCTION: model

def model(X_train, Y_train, X_test, Y_test, num_iterations = 2000, learning_rate = 0.5, print_cost = False):
    """
    Builds the logistic regression model by calling the function you've implemented previously

    Arguments:
    X_train -- training set represented by a numpy array of shape (num_px * num_px * 3, m_train)
    Y_train -- training labels represented by a numpy array (vector) of shape (1, m_train)
    X_test -- test set represented by a numpy array of shape (num_px * num_px * 3, m_test)
    Y_test -- test labels represented by a numpy array (vector) of shape (1, m_test)
    num_iterations -- hyperparameter representing the number of iterations to optimize the parameters
    learning_rate -- hyperparameter representing the learning rate used in the update rule of optimize()
    print_cost -- Set to true to print the cost every 100 iterations

    Returns:
    d -- dictionary containing information about the model.
    """

    ### START CODE HERE ###

    # initialize parameters with zeros (≈ 1 line of code)
    w, b = initialize_with_zeros(X_train.shape[0])

    # Gradient descent (≈ 1 line of code)
    parameters, grads, costs = optimize(w, b, X_train, Y_train, num_iterations, learning_rate, print_cost)

    # Retrieve parameters w and b from dictionary "parameters"
    w = parameters["w"]
    b = parameters["b"]

    # Predict test/train set examples (≈ 2 lines of code)
    Y_prediction_test = predict(w, b, X_test)
    Y_prediction_train = predict(w, b, X_train)

    ### END CODE HERE ###

    # Print train/test Errors
    print("train accuracy: {} %".format(100 - np.mean(np.abs(Y_prediction_train - Y_train)) * 100))
    print("test accuracy: {} %".format(100 - np.mean(np.abs(Y_prediction_test - Y_test)) * 100))


    d = {"costs": costs,
         "Y_prediction_test": Y_prediction_test,
         "Y_prediction_train" : Y_prediction_train,
         "w" : w,
         "b" : b,
         "learning_rate" : learning_rate,
         "num_iterations": num_iterations}

    return d
1. initialize_with_zeros 함수로 w, b 파라미터를 0으로 초기화
2. optimize 함수를 통해 학습
3. predict 함수로 예측값 확인
d = model(train_set_x, train_set_y, test_set_x, test_set_y, num_iterations = 2000, learning_rate = 0.005, print_cost = True)초기에 전처리했던 데이터들을 입력으로 학습시키면, 다음과 같은 결과를 얻을 수 있습니다.
(여기서 iteration은 2000회, learning_rate는 0.005를 사용했습니다)

train_set에서는 99퍼센트의 정확성을 가지고, 이렇게 학습된 모델로 test_set 결과를 확인하면 70%의 정확성을 가집니다.
실제로 심플한 모델로 그리 나쁜 정확성은 아니라고 볼 수는 있지만, 적은 수의 데이터를 가지고 학습했고, Logistic Regression은 선형 분류기이기 때문에 이러한 결과가 나오게 됬습니다. 다음 실습에서 우리는 더 좋은 분류기를 구현해봅시다.

임의의 샘플을 예측했을 때, 정상적으로 고양이로 판별하고 있습니다.
매 순회마다 Cost의 값을 그래프로 나타내봅시다.

학습이 진행됨에 따라 Cost가 감소하는 모습을 볼 수 있습니다.
6. Further analysis
위에서는 learning rate를 0.005로 설정하고 학습했는데, 다른 값에서는 어떠한 결과를 얻을 수 있는지 확인해봅시다.
여기서는 0.01, 0.001, 0.0001에서 어떤 결과를 얻는지 확인하였습니다.
learning_rates = [0.01, 0.001, 0.0001]
models = {}
for i in learning_rates:
    print ("learning rate is: " + str(i))
    models[str(i)] = model(train_set_x, train_set_y, test_set_x, test_set_y, num_iterations = 1500, learning_rate = i, print_cost = False)
    print ('\n' + "-------------------------------------------------------" + '\n')

for i in learning_rates:
    plt.plot(np.squeeze(models[str(i)]["costs"]), label= str(models[str(i)]["learning_rate"]))

plt.ylabel('cost')
plt.xlabel('iterations (hundreds)')

legend = plt.legend(loc='upper center', shadow=True)
frame = legend.get_frame()
frame.set_facecolor('0.90')
plt.show()
정확성이 점점 더 떨어지는 모습을 볼 수 있습니다.
따라서, 우리는 다음과 같은 결론을 내릴 수 있습니다.
- learning rate가 다르면 cost와 예측값이 다릅니다.
- learning rate가 0.01 같이 너무 크다면, cost는 크게 진동하는 모습을 띄며 심지어 발산(diverge)할 수 있습니다.(예제에서는 발산하지 않고, 괜찮은 cost값을 가지고 있습니다.
- 훨씬 작은 learning rate는 문제가 되지는 않지만, overfitting하지 않는지 확인할 필요는 있습니다. learning rate가 너무 작다면 training set에는 딱 맞지만, test set의 정확도는 떨어뜨릴 수 있습니다.
- Test with your own image
개인적인 이미지를 사용해서 테스트를 해봅시다.
구글링을 통해서 고양이 이미지를 구해서 입력해보았습니다.
## START CODE HERE ## (PUT YOUR IMAGE NAME)
my_image = "1.jpg"   # change this to the name of your image file
## END CODE HERE ##

# We preprocess the image to fit your algorithm.
fname = "images/" + my_image
image = np.array(ndimage.imread(fname, flatten=False))
image = image/255.
my_image = scipy.misc.imresize(image, size=(num_px,num_px)).reshape((1, num_px*num_px*3)).T
my_predicted_image = predict(d["w"], d["b"], my_image)

plt.imshow(image)
print("y = " + str(np.squeeze(my_predicted_image)) + ", your algorithm predicts a \"" + classes[int(np.squeeze(my_predicted_image)),].decode("utf-8") +  "\" picture.")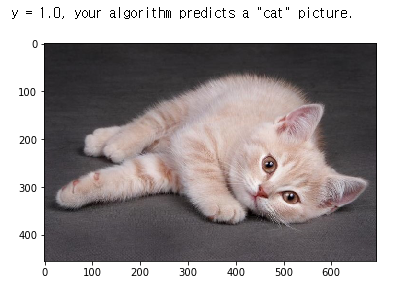
정상적으로 고양이로 판단하였습니다.
'Coursera 강의 > Deep Learning' 카테고리의 다른 글
| [실습] Building Deep Neural Network : Step by Step (0) | 2020.09.25 |
|---|---|
| [실습] Planar data classification with a hidden layer (9) | 2020.09.25 |
| Practical aspects of Deep Learning 2 (3) | 2020.09.23 |
| Practical aspects of Deep Learning 1 (1) | 2020.09.23 |
| Deep Neural Network(DNN) (0) | 2020.09.20 |


댓글