(tensorflow v2.3.0 - jupyter notebook)
이번에는 momentum과 adam optimization을 사용해서 mini-batch GD, mini-batch GD with momentum, mini-batch GD with adam, 이 3가지의 학습을 비교해보도록 하겠습니다.
mini-batch, momentum, adam에 대해서는 아래 게시글을 참조하시기 바랍니다.
2020/10/02 - [Coursera 강의/Deep Learning] - Optimization(최적화 알고리즘) : Mini-batch/Momentum/RMSprop/Adam
Optimization(최적화 알고리즘) : Mini-batch/Momentum/RMSprop/Adam
해당 내용은 Coursera의 딥러닝 특화과정(Deep Learning Specialization)의 두 번째 강의 Improving Deep Neural Networks: Hyperparameter tuning, Regularization and Optimization를 듣고 정리한 내용입니다. (..
junstar92.tistory.com
[실습] Optimization Methods(Mini-batch, Momentum, Adam Algorithm)
해당 내용은 Coursera의 딥러닝 특화과정(Deep Learning Specialization)의 두 번째 강의 Improving Deep Neural Networks: Hyperparameter tuning, Regularization and Optimization를 듣고 정리한 내용입니다. (..
junstar92.tistory.com
1. Dataset과 필요한 함수 구현
import numpy as np
import tensorflow as tf
import sklearn.datasets
import matplotlib.pyplot as plt

%matplotlib inline
plt.rcParams['figure.figsize'] = (7.0, 4.0) # set default size of plots
plt.rcParams['image.interpolation'] = 'nearest'
plt.rcParams['image.cmap'] = 'gray'

def load_dataset():
    np.random.seed(3)
    train_X, train_Y = sklearn.datasets.make_moons(n_samples=300, noise=.2) #300 #0.2
    # Visualize the data
    plt.scatter(train_X[:, 0], train_X[:, 1], c=train_Y, s=40, cmap=plt.cm.Spectral);

    return train_X, train_Y

def plot_decision_boundary(model, X, y):
    # Set min and max values and give it some padding
    x_min, x_max = X[:, 0].min() - 1, X[:, 0].max() + 1
    y_min, y_max = X[:, 1].min() - 1, X[:, 1].max() + 1
    h = 0.01
    # Generate a grid of points with distance h between them
    xx, yy = np.meshgrid(np.arange(x_min, x_max, h), np.arange(y_min, y_max, h))
    # Predict the function value for the whole grid
    Z = model(np.c_[xx.ravel(), yy.ravel()])
    Z = Z.reshape(xx.shape)
    # Plot the contour and training examples
    plt.contourf(xx, yy, Z, cmap=plt.cm.Spectral)
    plt.ylabel('x2')
    plt.xlabel('x1')
    plt.scatter(X[:, 0], X[:, 1], c=y, cmap=plt.cm.Spectral)
    plt.show()

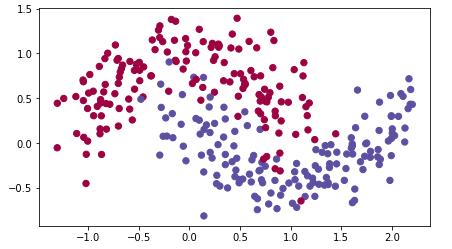
train_X, train_Y = load_dataset()
위와 같은 분포를 갖는 data를 색깔별로 분류해보고 decision boundary를 살펴보도록 하겠습니다.
2. Model 구현
우선 momentum은 약간 익숙한 tf.keras.optimizers.SGD를 사용하면 됩니다. 이 optimizer는 Stochastic Gradient Descent를 의미하고, 아래와 같은 매개변수를 갖습니다.

이전까지의 게시글에서는 momentum을 사용하지 않았기 때문에, momentum에 0.0이 자동으로 입력되고, 이로 인해서 momentum은 적용이 되지 않았습니다. 따라서, 단순 GD나 GD with momentum이나 동일한 optimizer를 사용하게 됩니다.
다음으로 Adam optimization의 경우에는 tf.keras.optimizers.Adam을 사용하면 적용할 수 있습니다.

위의 매개변수들을 가질 수 있으며, 강의에 따르면 주로 learning_rate나 beta_1 정도만 하이퍼파라미터로 우리가 바꿔가면서 선택하면 되고, beta_2나 epsilon의 경우에는 그냥 기본값을 사용해도 충분하다고 합니다.
모델 구현은 다음과 같습니다.
def Model(X, Y, layers_dims, opt, learning_rate=0.0007, batch_size=64,
          beta=0.9, beta1=0.9, beta2=0.999, epsilon=1e-8, num_epochs=10000):
    tf.random.set_seed(2)
    L = len(layers_dims)
    costs = []

    if opt=='SGD':
        optimizer=tf.keras.optimizers.SGD(learning_rate=learning_rate)
    elif opt=='momentum':
        optimizer=tf.keras.optimizers.SGD(learning_rate=learning_rate, momentum=beta)
    elif opt=='adam':
        optimizer=tf.keras.optimizers.Adam(learning_rate=learning_rate,
                                           beta_1=beta1, beta_2=beta2, epsilon=epsilon)

    initializer = tf.keras.initializers.glorot_uniform(seed=2)

    model = tf.keras.models.Sequential([
        tf.keras.layers.Input(shape=(X.shape[1],))
    ])

    for i in range(1, L):
        if i != L-1:
            model.add(
                tf.keras.layers.Dense(layers_dims[i],
                                      activation='relu',
                                      kernel_initializer=initializer))
        else:
            model.add(
                tf.keras.layers.Dense(layers_dims[i],
                                      activation='sigmoid',
                                      kernel_initializer=initializer))

    model.summary()

    model.compile(
        optimizer=optimizer,
        loss='binary_crossentropy',
        metrics=['accuracy']
    )

    hist = model.fit(X, Y, batch_size=batch_size, epochs=num_epochs, verbose=0)

    for i in range(0, num_epochs, 1000):
        costs.append(hist.history['loss'][i])

        if i % 1000 == 0:
            print(f"Cost after interation {i}: {hist.history['loss'][i]}")

    #plot the cost
    plt.plot(costs)
    plt.ylabel('cost')
    plt.xlabel('epochs (per 100)')
    plt.title('Learning rate ='+ str(learning_rate))
    plt.show()

    train_acc = hist.history['accuracy'][-1]
    print(f'Accruacy : {train_acc}')

    plt.title('Model with ' + str(opt) +' optimization')
    axes = plt.gca()
    axes.set_xlim([-1.5, 2.5])
    axes.set_ylim([-1, 1.5])
    plot_decision_boundary(lambda x: model.predict(x) > 0.5, X, Y)

    return model, hist
이전 글과 유사하지만, 이번에는 opt 매개변수를 통해서 optimizer의 종류를 선택해주고 있습니다. mini-batch를 적용하기 위해서 batch_size도 인자로 받으며, 기본으로 64로 되어있는데 변경하지 않고 batch_size는 64로 고정하고 테스트를 해보려고 합니다.
구성하려고 하는 모델은 input/output layer와 2개의 hidden layer로 구성되어 있습니다.
layers_dims = [train_X.shape[1], 5, 2, 1]
3-1. mini-batch GD
기본적인 GD를 사용해서 학습을 진행해보겠습니다.
m1, h1 = Model(train_X, train_Y, layers_dims, opt='SGD')
약 85%의 정확도를 가지고 있으며, decision boundary는 다음과 같습니다. 약간 선형적으로 구분되어 있는 것을 볼 수 있습니다.
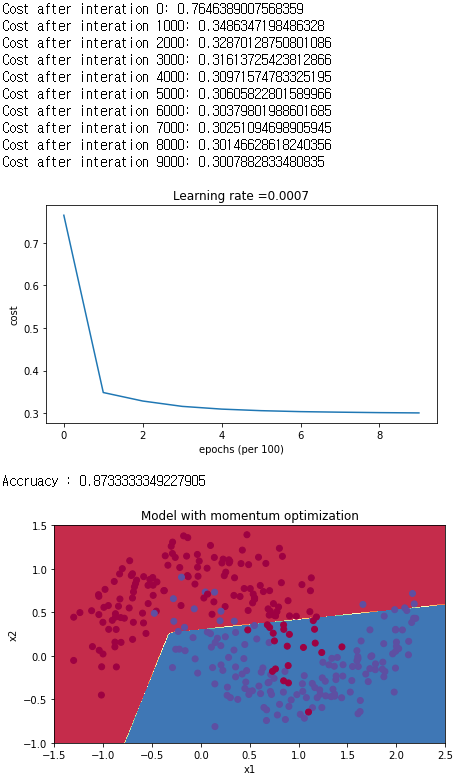
3-2. mini-batch with momentum
m2, h2 = Model(train_X, train_Y, layers_dims, opt='momentum', beta=0.9)이번에는 계수가 0.9인 momentum을 적용해서 학습을 해보도록 하겠습니다.

약 87%의 정확도를 갖고 있으며, momentum을 적용하지 않은 결과와 크게 다르지 않는 것을 볼 수 있습니다.
3-3. mini-batch with adam optimization
이번에는 adam optimizer를 사용해서 학습해보도록 하겠습니다.
m3, h3 = Model(train_X, train_Y, layers_dims, opt='adam', beta1=0.9, beta2=0.999, epsilon=1e-8)
약 93%의 정확도를 보이고 있습니다. 이전 결과들과는 다르게 눈에 띄게 정확도가 높아졌습니다.
4. 결과 비교
| Optimization | Train Accuracy |
| SGD | 85.6% |
| Momentum | 87.3% |
| Adam | 93.6% |
이번 게시글에서 3가지의 최적화 알고리즘을 비교해보았는데, 아래처럼 많은 optimizer가 있습니다.
사실 잘 모르겠으면 그냥 Adam을 사용하는 것이 가장 좋다고는 합니다.. !

'ML & DL > tensorflow' 카테고리의 다른 글
| Hand SIGNS 분류 예제 (2) - CNN 구조 사용 (0) | 2020.11.17 |
|---|---|
| Hand SIGNS 분류 예제 (1) (0) | 2020.11.17 |
| Regularization 적용에 따른 학습 비교 (0) | 2020.11.16 |
| Initialization에 따른 학습 비교 (0) | 2020.11.15 |
| Cat Classification (2) : L-layers Neural Network (0) | 2020.11.15 |


댓글