(tensorflow v2.4.0)
tensorflow에서는 Sequential API를 사용해서 Layer를 순차적으로 쌓아서 모델을 구성할 수도 있지만, Functional API를 통해서 입력 또는 출력이 여러개거나, 중간에 branch를 만들어서 분리를 하는등 조금 더 Flexibile한 모델을 구성할 수 있습니다.

기본적인 Sequential Model은 다음과 같이 구현할 수 있습니다.
import tensorflow as tf

def build_model_with_sequential():

    # instantiate a Sequential class and linearly stack the layers of your model
    seq_model = tf.keras.models.Sequential([tf.keras.layers.Flatten(input_shape=(28, 28)),
                                            tf.keras.layers.Dense(128, activation=tf.nn.relu),
                                            tf.keras.layers.Dense(10, activation=tf.nn.softmax)])
    return seq_model
그리고 Functional API를 사용한 모델은 다음과 같이 구현할 수 있습니다. 함수콜과 동일한 문법을 사용해서 한층 한층 결과를 얻어서 진행하는 형식입니다.
def build_model_with_functional():

    # instantiate the input Tensor
    input_layer = tf.keras.Input(shape=(28, 28))

    # stack the layers using the syntax: new_layer()(previous_layer)
    flatten_layer = tf.keras.layers.Flatten()(input_layer)
    first_dense = tf.keras.layers.Dense(128, activation=tf.nn.relu)(flatten_layer)
    output_layer = tf.keras.layers.Dense(10, activation=tf.nn.softmax)(first_dense)

    # declare inputs and outputs
    func_model = Model(inputs=input_layer, outputs=output_layer)

    return func_model
2개의 output을 가지는 Model 구성
기본적으로 Functional API를 사용하면 위의 방법으로 모델을 구성할 수 있습니다.
이제, 에너지 효율에 관한 dataset을 사용해서 하나의 입력과 두개의 출력을 가지는 모델을 구성해보도록 하겠습니다.
Data는 Link를 통해서 확인할 수 있습니다.
import pandas as pd
from sklearn.model_selection import train_test_split

URL = 'https://archive.ics.uci.edu/ml/machine-learning-databases/00242/ENB2012_data.xlsx'

df = pd.read_excel(URL)
df.head(10)
Data는 8개의 feature들이 입력과, 2개의 출력, Heating Load(난방부하), Cooling Load(냉방부하)로 이루어져 있습니다.

Data들을 sklearn의 train_test_split을 통해서 8:2의 비율로 나누어서, train set과 test set으로 분리하고, 전처리과정으로 normalization을 적용하도록 하겠습니다.
# split to train and test set
train, test = train_test_split(df, test_size=0.2)

# get mean and std of train dataset for noramlizing
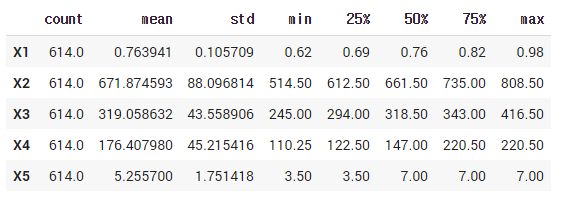
train_stats = train.describe()
train_stats.pop('Y1')
train_stats.pop('Y2')
train_stats = train_stats.transpose()
train_stats.head()

# get output y of train and test set
train_Y = [np.array(train.pop('Y1')), np.array(train.pop('Y2'))]
test_Y = [np.array(test.pop('Y1')), np.array(test.pop('Y2'))]

# normalization
train = (train - train_stats['mean']) / train_stats['std']
이제 모델을 구성해보도록 하겠습니다.
from tensorflow.keras.models import Model
from tensorflow.keras.layers import Dense, Input

# define model layers
input_layer = Input(shape=(len(train.columns),))
first_dense = Dense(128, activation='relu')(input_layer)
second_dense = Dense(128, activation='relu')(first_dense)

# define y1 output and third dense
y1_output = Dense(1, name='y1_output')(second_dense)
third_dense = Dense(64, activation='relu')(second_dense)

# define y2 output
y2_output = Dense(1, name='y2_output')(third_dense)

# define model with the input layer and a list of output layers
model = Model(inputs=input_layer, outputs=[y1_output, y2_output])

print(model.summary())
y1_output은 second_dense로부터 값이 예측되고, y2_output은 third_dense로부터 예측됩니다.
모델의 그래프를 살펴보면 다음과 같습니다.
tf.keras.utils.plot_model(model, show_shapes=True, show_layer_names=True)
여기서 output layer들에게 name 파라미터로 layer의 이름을 지정해주었습니다. 각각의 output에게 특정 loss와 metrics을 지정해주기 위함인데, 이 예제에서는 둘다 동일한 loss와 metric을 사용하고 있습니다.(각각 다른 loss와 metrics을 지정할 수도 있습니다.)
따라서 다음과 같이 모델의 optimizer와 loss, metrics를 지정해서 학습을 진행할 수 있습니다.
# Specify the optimizer, and compile the model with loss functions for both outputs
optimizer = tf.keras.optimizers.SGD(lr=0.001)
model.compile(optimizer=optimizer,
              loss={'y1_output': 'mse', 'y2_output': 'mse'},
              metrics={'y1_output': tf.keras.metrics.RootMeanSquaredError(),
                       'y2_output': tf.keras.metrics.RootMeanSquaredError()})

# Train the model for 500 epochs
history = model.fit(norm_train_X, train_Y,
                    epochs=500, batch_size=10, validation_data=(norm_test_X, test_Y))
y1_output과 y2_output의 loss와 metrics 결과를 각각 확인할 수 있습니다.
Siamese Network 샴 네트워크

Siamese Network는 샴쌍둥이에서 착안된 네트워크로, 2개의 input을 가지고 같은 네트워크를 통해서 output vector가 추출되는 구조를 갖고 있습니다. 그리고, 이 vector들은 서로 비교를 통해서 두 입력의 유사도를 측정할 수도 있습니다.
(Siamese Network는 얼굴 인식에서 One-shot learning을 위해서 자주 사용됩니다.
참조 : 2020/11/30 - [Coursera 강의/Deep Learning] - Face recognition)
이번에는 이런 Siamese Network을 사용해서 아래와 같은 구조를 갖는 Fashion MNIST data 쌍을 비교하는 모델을 구성해보도록 하겠습니다. 신경망을 통해서 출력된 output vector들은 Euclidean Distance를 통해서 유사도가 측정되고 모델의 output이 바로 두 이미지의 유사도 결과가 됩니다.

그럼 tensorflow에서 제공하는 Fashion MNIST data를 불러와서, 진행해보도록 하겠습니다.
from tensorflow.keras.datasets import fashion_mnist
import random

# load datasets
(train_images, train_labels), (test_images, test_labels) = fashion_mnist.load_data()

# normalization
train_images = train_images / 255.
test_images = test_images / 255.

# create pairs on train and test sets
def create_pairs(x, y):
    pairs = []
    labels = []

    digit_indices = [np.where(y == i)[0] for i in range(10)]
    n = min([len(digit_indices[d]) for d in range(10)]) - 1

    for d in range(10):
        for i in range(n):
            z1, z2 = digit_indices[d][i], digit_indices[d][i+1]
            pairs += [[x[z1], x[z2]]]
            inc = random.randrange(1, 10)
            dn = (d + inc) % 10
            z1, z2 = digit_indices[d][i], digit_indices[dn][i]
            pairs += [[x[z1], x[z2]]]
            labels += [1, 0]
    return np.array(pairs), np.array(labels).astype('float32')

tr_pairs, tr_y = create_pairs(train_images, train_labels)
ts_pairs, ts_y = create_pairs(test_images, test_labels)
data를 load하고, normalization을 진행한 후에 한 쌍의 이미지 dataset을 만들어주었습니다.
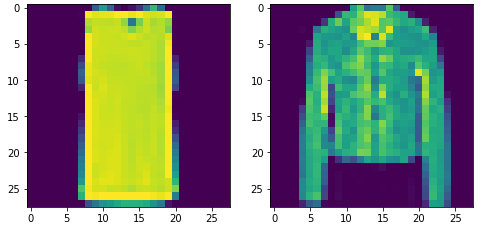
testset을 확인해봅시다.
import matplotlib.pyplot as plt
def show_image(image1, image2):
    plt.figure(figsize=(8, 4))
    plt.grid(False)

    plt.subplot(1,2,1)
    plt.imshow(image1)

    plt.subplot(1,2,2)
    plt.imshow(image2)
    plt.show()

this_pair = 8
# show images at this index
show_image(ts_pairs[this_pair][0], ts_pairs[this_pair][1])
show_image(ts_pairs[3][0], ts_pairs[3][1])
한쌍의 데이터를 만들때, 짝수번째는 동일한 라벨의 이미지, 홀수번째는 다른 라벨의 이미지를 지정했기 때문에 위와 같이 확인할 수 있습니다.
이제 Siamese Network를 구성해보도록 하겠습니다.
먼저, output vector를 추출하기 위한 기본 베이스 모델과 두 vector의 similarity 측정을 위한 eucliean_distance 함수 입니다.
from tensorflow.keras.layers import Flatten

def base_network():
    input = Input(shape=(28, 28), name='base_input')
    x = Flatten(name='flatten_input')(input)
    x = Dense(128, activation='relu', name='first_base_dense')(x)
    x = Dropout(0.1, name='first_dropout')(x)
    x = Dense(128, activation='relu', name='second_base_dense')(x)
    x = Dropout(0.1, name='second_dropout')(x)
    x = Dense(128, activation='relu', name='third_base_dense')(x)

    return Model(inputs=input, outputs=x)

def euclidean_distance(vects):
    x, y = vects
    sum_square = tf.math.reduce_sum(tf.math.square(x - y), axis=1, keepdims=True)
    return tf.math.sqrt(tf.math.maximum(sum_square, 1e-7))
여기서 유클리디안 거리는 아래의 공식으로 구하며, 만약 1e-7보다 작다면 그 값을 1e-7로 설정하도록 하였습니다.

from tensorflow.keras.utils import plot_model
base_model = base_network()
plot_model(base_model, show_shapes=True, show_layer_names=True)
이제 Siamese network를 구성해보도록 하겠습니다.
from tensorflow.keras.layers import Lambda

input_a = Input(shape=(28,28,), name='left_input')
vector_output_a = base_model(input_a)

input_b = Input(shape=(28,28,), name='right_input')
vector_output_b = base_model(input_b)

output = Lambda(euclidean_distance, name='output_layer')([vector_output_a, vector_output_b])

# define model
model = Model([input_a, input_b], output)
plot_model(model, show_shapes=True, show_layer_names=True)
left_input과 right_input이 동일한 네트워크를 통과하고 있습니다. 그리고, Lambda layer를 통해서 두 vector output의 유클리디안 거리를 출력하게 됩니다.
이제 모델을 compile하고 학습을 진행하는데, 여기서 custom loss를 사용합니다. Lambda layer와 Custom loss는 다음 게시글에서 설명하도록 하겠습니다 !
사용되는 loss는 contrastive loss이며, 다음과 같이 계산됩니다.

from tensorflow.keras.optimizers import RMSprop

def contrastive_loss_with_margin(margin):
    def contrastive_loss(y_true, y_pred):
        '''Contrastive loss from Hadsell-et-al.'06
        http://yann.lecun.com/exdb/publis/pdf/hadsell-chopra-lecun-06.pdf
        '''
        square_pred = tf.math.square(y_pred)
        margin_square = tf.math.square(tf.math.maximum(margin - y_pred, 0))
        return tf.math.reduce_mean(y_true * square_pred + (1 - y_true) * margin_square)
    return contrastive_loss

rms = RMSprop()
model.compile(loss=contrastive_loss_with_margin(margin=1), optimizer=rms)
history = model.fit([tr_pairs[:,0], tr_pairs[:,1]], tr_y, epochs=20, batch_size=128, validation_data=([ts_pairs[:,0], ts_pairs[:,1]], ts_y))
학습이 완료되었습니다. 이제 test set을 사용해 학습된 모델이 얼마나 잘 추측하는지 평가해보도록 하겠습니다.
def compute_accuracy(y_true, y_pred):
    '''Compute classification accuracy with a fixed threshold on distances.
    '''
    pred = y_pred.ravel() < 0.5
    return np.mean(pred == y_true)

loss = model.evaluate([ts_pairs[:,0],ts_pairs[:,1]], ts_y)

y_pred_train = model.predict([tr_pairs[:,0], tr_pairs[:,1]])
train_accuracy = compute_accuracy(tr_y, y_pred_train)

y_pred_test = model.predict([ts_pairs[:,0], ts_pairs[:,1]])
test_accuracy = compute_accuracy(ts_y, y_pred_test)

print("Loss = {}, Train Accuracy = {} Test Accuracy = {}".format(loss, train_accuracy, test_accuracy))
그리고 Loss의 변화를 그래프로 나타내보겠습니다.
def plot_metrics(metric_name, title, ylim=5):
    plt.title(title)
    plt.ylim(0,ylim)
    plt.plot(history.history[metric_name],color='blue',label=metric_name)
    plt.plot(history.history['val_' + metric_name],color='green',label='val_' + metric_name)
    plt.legend()


plot_metrics(metric_name='loss', title="Loss", ylim=0.2)
마지막으로 측정한 유사도를 몇 개의 샘플을 뽑아서 살펴보도록 하겠습니다.
def display_images(left, right, predictions, labels, title, n):
	plt.figure(figsize=(17,3))
	plt.title(title)
	plt.yticks([])
	plt.xticks([])
	plt.grid(None)
	left = np.reshape(left, [n, 28, 28])
	left = np.swapaxes(left, 0, 1)
	left = np.reshape(left, [28, 28*n])
	plt.imshow(left)
	plt.figure(figsize=(17,3))
	plt.yticks([])
	plt.xticks([28*x+14 for x in range(n)], predictions)
	for i,t in enumerate(plt.gca().xaxis.get_ticklabels()):
	    if predictions[i] > 0.5: t.set_color('red') # bad predictions in red
	plt.grid(None)
	right = np.reshape(right, [n, 28, 28])
	right = np.swapaxes(right, 0, 1)
	right = np.reshape(right, [28, 28*n])
	plt.imshow(right)

y_pred_train = np.squeeze(y_pred_train)
indexes = np.random.choice(len(y_pred_train), size=10)
display_images(tr_pairs[:, 0][indexes], tr_pairs[:, 1][indexes], y_pred_train[indexes], tr_y[indexes], "clothes and their dissimilarity", 10)
같은 라벨의 이미지는 유클리디안 거리의 값이 0에 가깝다는 것을 확인할 수 있습니다.
- 참조
Coursera - Custom Models, Layers, and Loss Functions with TensorFlow : week 1
'ML & DL > tensorflow' 카테고리의 다른 글
| [tensorflow] Custom Lambda layer / Custom layer (0) | 2021.01.11 |
|---|---|
| [tensorflow] Custom Loss (Huber Loss, Contrastive Loss 구현) (0) | 2021.01.11 |
| [Kaggle] Dog Breed Identification (0) | 2021.01.01 |
| [tensorflow] naver 영화 리뷰 감성 분석 (1) | 2020.12.24 |
| 감성분류 on IMDB datasets (2) (0) | 2020.12.24 |


댓글