2020/11/05 - [ML and DL] - Seaborn tutorial (2-1) : displot() - histogram
2020/11/06 - [ML and DL] - Seaborn tutorial (2-2) : displot() - kernel density
이전 글에 이어서, 이번에는 ECDF(Empirical cumulative distribution function)과 displot()의 여러가지 setting 방법에 대해서 간단하게 알아보겠습니다.(jointplot()
Empirical cumulative distibutions
ECDF는 경험적 누적분포 함수라고 부르고, 서로 다른 표본들의 분포를 비교할 때 많이 사용하고, 각 집단의 백분위를 추정할 수 있습니다. 이전 게시글에서 사용하던 penguins dataset을 사용해서 ECDF 그래프를 그려보겠습니다.
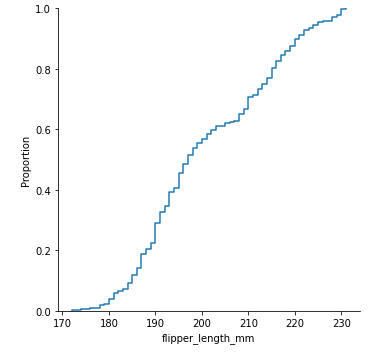
매개변수 kind를 "ecdf"로 설정해주면 됩니다.
sns.displot(penguins, x="flipper_length_mm", kind="ecdf")
간략히 그래프에 대해서 설명하자면, y축은 x축의 값이 전체 데이터에서 차지하는 비율을 의미합니다. 그리고 histogram이나 KDE와는 다르게 각 지점의 data를 생략하지 않고 전부 나타내고 있습니다. 따라서, 그래프를 해석하는데 bin의 크기나 smoothing parameter를 고려할 필요가 없습니다. 또한, 곡선이 단조롭게(monotonically) 증가하기 때문에 multiple distribution을 비교하는데 적합합니다.
ECDF 그래프 또한, 'hue' 파라미터를 사용해서 그래프에 추가적인 데이터를 나타낼 수 있습니다.
sns.displot(penguins, x="flipper_length_mm", hue="species", kind="ecdf")
Distribution visualization in other setting
1. jointplot()
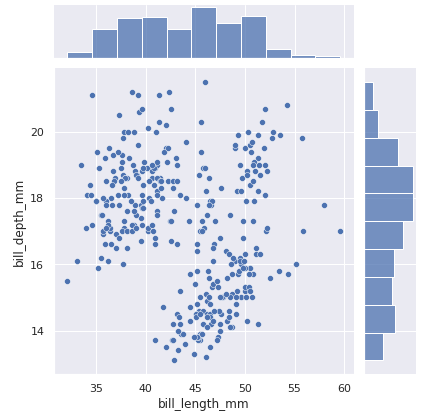
jointplot()은 두 변수를 각각 relational plot과 distribution plot로 나타내서 한번에 그려주는 함수입니다. 기본값으로는 scatterplot()과 histplot()을 한번에 나타냅니다. 그리고 jointplot()은 data가 키워드타입이기 때문에 'data=penguins'로 키워드 대입으로 매개변수를 입력해주어야 합니다.
sns.jointplot(data=penguins, x="bill_length_mm", y="bill_depth_mm")
displot()과 유사하게 kind="kde"로 파라미터를 설정하면, contour를 아래와 같이 나타냅니다.
sns.jointplot(data=penguins, x="bill_length_mm", y="bill_depth_mm", hue="species", kind="kde")
또한, 직접 사용할 그래프들을 지정해줄 수 있기 때문에 유연하게 사용할 수 있습니다. 중간의 main plot은 plot_joint로, 주변의 marginal plot은 plot_marginals로 설정해줄 수 있습니다.
g = sns.JointGrid(data=penguins, x="bill_length_mm", y="bill_depth_mm")
g.plot_joint(sns.histplot)
g.plot_marginals(sns.boxplot)
2. pairplot()
pairplot()은 joint와 margianl 분포를 합성한 것과 유사하게 그래프를 나타내는데, 각 변수들의 분포와 모든 변수 pair의 분포 관계를 시각화합니다.
sns.pairplot(penguins)
오른쪽 대각선에 위치하는 그래프는 histogram으로 각 단일 변수의 count를 나타내는 histplot이며, 다른 그래프들은 각 x축, y축 변수들을 scatterplot으로 나타낸 것과 동일합니다.
JointGrid와 동일하게, 직접적으로 설정할 수 있습니다. 자세한 API는 공식문서를 참조바랍니다.
g = sns.PairGrid(penguins)
g.map_upper(sns.histplot)
g.map_lower(sns.kdeplot, fill=True)
g.map_diag(sns.histplot, kde=True)
'ML & DL > 시각화 도구' 카테고리의 다른 글
| Seaborn tutorial (2-2) : displot() - kernel density (0) | 2020.11.06 |
|---|---|
| Seaborn tutorial (2-1) : displot() - histogram (0) | 2020.11.05 |
| Seaborn tutorial (1-2) : relplot() - line plot (0) | 2020.11.04 |
| Seaborn tutorial (1-1) : relplot() - scatter plot (0) | 2020.11.04 |


댓글